World Cup 2026: How Much Does a Panini Album Really Cost?
Why the last stickers are the most expensive.
The innocent beginning
Filling a Panini album usually starts out as great fun. The first few packs make for fast progress. Almost every sticker is new, the pages fill up, and for a brief moment you get the impression that a complete album is just around the corner. Then comes the phase where you pull the same right back from Group H for the third time and slowly realise there is still a long way to go.
The official sticker collection for the FIFA Football World Cup 2026 is large. Very large. According to Panini, the main collection contains 980 stickers: 48 national teams with 20 stickers each, plus 20 special stickers on World Cup history (Panini Group 2026). Each pack contains seven stickers. The softcover album costs €2.00 in the German Panini shop and includes six stickers (Panini Deutschland 2026b). A box of 100 packs costs €150.00, which works out to €1.50 per pack (Panini Deutschland 2026c).
The naive calculation is quick:
\[ \frac{980 - 6}{7} \approx 139{.}1 \]
About 140 packs, starting with the six starters from the album. That would be roughly €210 plus the album. Sounds alright? Unfortunately, this calculation is about as optimistic as tipping 4-0 for Cape Verde against Spain, because it implicitly assumes every pack contains only new stickers.
That is not what happens.
The question of this post is therefore not only why collecting becomes so tedious towards the end. I am also interested in how expensive different collecting strategies are under current conditions: buying packs only, ordering missing stickers at some point, or trading within a group. To answer this, I use two levels. First, a few classical problems from probability theory help to understand the order of magnitude. Then I simulate the concrete strategies using the prices, pack sizes, and reorder rules of the current collection.
This is not a new question. Panini albums are almost a textbook example of how illustrative probability theory can be. The article by Hayes and Hannigan (2006) discusses trading when completing a football World Cup sticker album for the 2006 tournament; Numberphile (2018) later covered the topic in a video; and for the 2026 World Cup the cost question was discussed again in the press (Rumsby 2026). Braband, Braband, and Braband (2016) also examine how realistic the classical assumptions of the coupon collector problem actually are for sticker albums.
Precisely because the problem is so well known, it works well for teaching. I discuss variants of it regularly with students: you can explain expected values, distributions, simulation, model assumptions, and practical decisions using an example that almost everyone can picture immediately. This post is therefore also an updated collection: what does classical theory say? What changes when you introduce packs, trading, and reordering? And what happens when you actually run the numbers for the 2026 World Cup collection?
The coupon collector problem
The Panini album is a classical coupon collector problem. You are not simply collecting 980 things. You are buying random draws from a pool of 980 possible motifs. At the start, almost every draw is a new one. Later, almost every draw is a duplicate.
When only a few stickers are in the album, the probability of getting a new one is high. When 930 of the 980 stickers are already in, only 50 are missing. The probability that a randomly drawn sticker is actually new is then only:
\[ \frac{50}{980} \approx 5{.}1\%. \]
In other words: at that point, roughly 19 out of 20 randomly drawn stickers are no longer any help. They are not worthless, but they only help if you find someone to trade with who happens to need exactly that player.
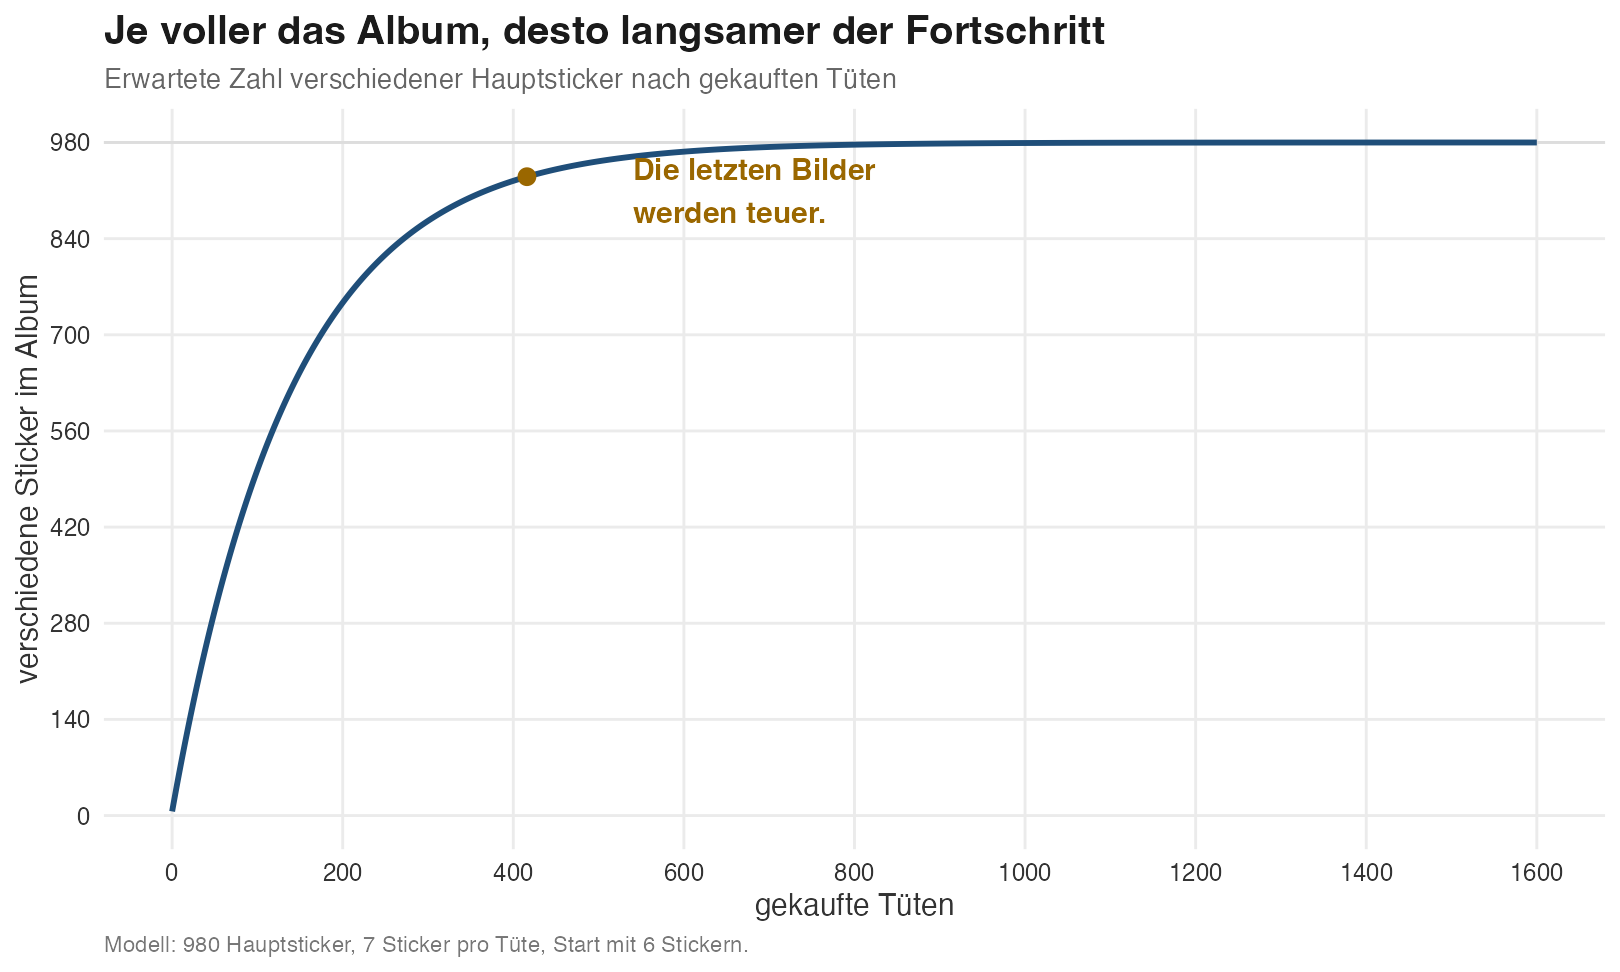
Figure 1 shows this basic logic. Progress is steep at first and then gets increasingly slow. Not because Panini secretly has it in for our nerves, but because randomness with repetition works exactly like this.
Three collecting strategies
For this post I consider three collecting strategies:
- Packs only. You buy packs until the album is complete.
- Packs, then reorder. You buy packs until at most 50 stickers are missing, then order those directly (€0.50 per sticker, maximum 50 stickers, so at most €25; postage not included (Panini Deutschland 2026a)).
- Group trading. Several people collect in parallel and pool their duplicates. Within the group, trading is idealised. Afterwards, if at most 50 stickers are missing per person, the remaining stickers are ordered directly.
This post uses a simulation to model the sticker collecting process for these three strategies. The simulation covers only the 980 main stickers. Extra stickers, special variants, and digital coupons are ignored. The six stickers that come with the album are treated as six distinct main stickers. Each pack is modelled as an independent random draw of seven stickers. This is an approximation, but a useful one: it isolates the central effect of duplicates.
Group trading is deliberately idealised. When a group has enough copies of a sticker, they are distributed so that as many albums as possible benefit. In the real world this sometimes breaks down due to logistics, WhatsApp groups, and people who never sort their duplicates.
Postage for reordering is not included, as it depends on the ordering channel. For the order of magnitude this does not matter much: 50 directly ordered stickers cost €25. Drawn randomly from packs they can cost several hundred euros more.
Are the stickers really uniformly distributed?
The simulation contains an important model assumption: every main sticker is equally likely. That is not the same as claiming that every real Panini album in every country and every sales phase is delivered with a perfect uniform distribution.
This assumption has been debated repeatedly for earlier albums. Dambeck (2014) reported in Der Spiegel, based on 8.33 million stickers recorded at stickermanager.com, on significant deviations from a uniform distribution in the German World Cup album. Dambeck (2018) returned to the topic, this time focusing on the silver “Glitzi” stickers in Germany and Austria; Panini denied any unequal production or distribution at the time.
There are also counter-examples. Sardy and Velenik (2008) examined samples from several boxes for an earlier Swiss World Cup album and could not reject the uniform distribution assumption in their data. What is interesting is precisely this mix: you cannot simply say that Panini stickers are always uniform or always non-uniform. For the simulation this means: the uniform distribution is a transparent baseline assumption. If some motifs are genuinely rarer, the costs estimated here would be on the low side, because the last rare stickers would make the problem even worse.
As a first model, the uniform distribution is useful because it isolates the pure randomness effect. Even with a fair distribution, many duplicates and high costs towards the end arise. Non-uniformity would not replace the coupon collector problem — it would be an additional difficulty on top.
One problem, several mathematical variants
Behind the Panini album there are actually several closely related problems. Distinguishing them helps to be precise about which calculation is in play.
The classical coupon collector
The classical coupon collector variant without trading asks: how many individual random draws are needed on average until each of \(n\) motifs has been drawn at least once? For equally likely motifs the expected value is
\[ n \cdot H_n = n \cdot \left(1 + \frac{1}{2} + \frac{1}{3} + \ldots + \frac{1}{n}\right), \]
where \(n\) is the number of possible motifs and \(H_n\) is the \(n\)-th harmonic number. For large \(n\) this is approximately \(n \log(n) + \gamma n\), where \(\gamma \approx 0{.}577\) is the Euler-Mascheroni constant. Dawkins (1991) discusses this waiting time and its distribution accessibly under the title “Siobhan’s Problem”.
For our album, \(n = 980\). Because the album already contains six stickers, you do not start from zero. For simplicity I also assume these six starting stickers are all distinct. The theoretical expected value for the additionally needed individual draws is then
\[ 980 \cdot H_{974} \approx 7{,}310. \]
Divided by seven stickers per pack, that is roughly 1,044 packs. At €1.50 per pack plus €2.00 for the album, the theoretical expected value is around €1,570. This is almost exactly the mean of the simulation for “packs only until complete” in Table 1. The strategy “stop at 50 missing, then reorder” also works as a plausibility check: theoretically you need around 415 packs on average to get from six stickers to 930 distinct ones. Add €25 for 50 directly ordered stickers and you land at roughly €650.
For the classical variant you can also look beyond the expected value. For large albums, the distribution of the collecting time is well approximated by a Gumbel distribution after a suitable shift. Specifically, the random variable
\[ \frac{T}{n} - \log(r) \]
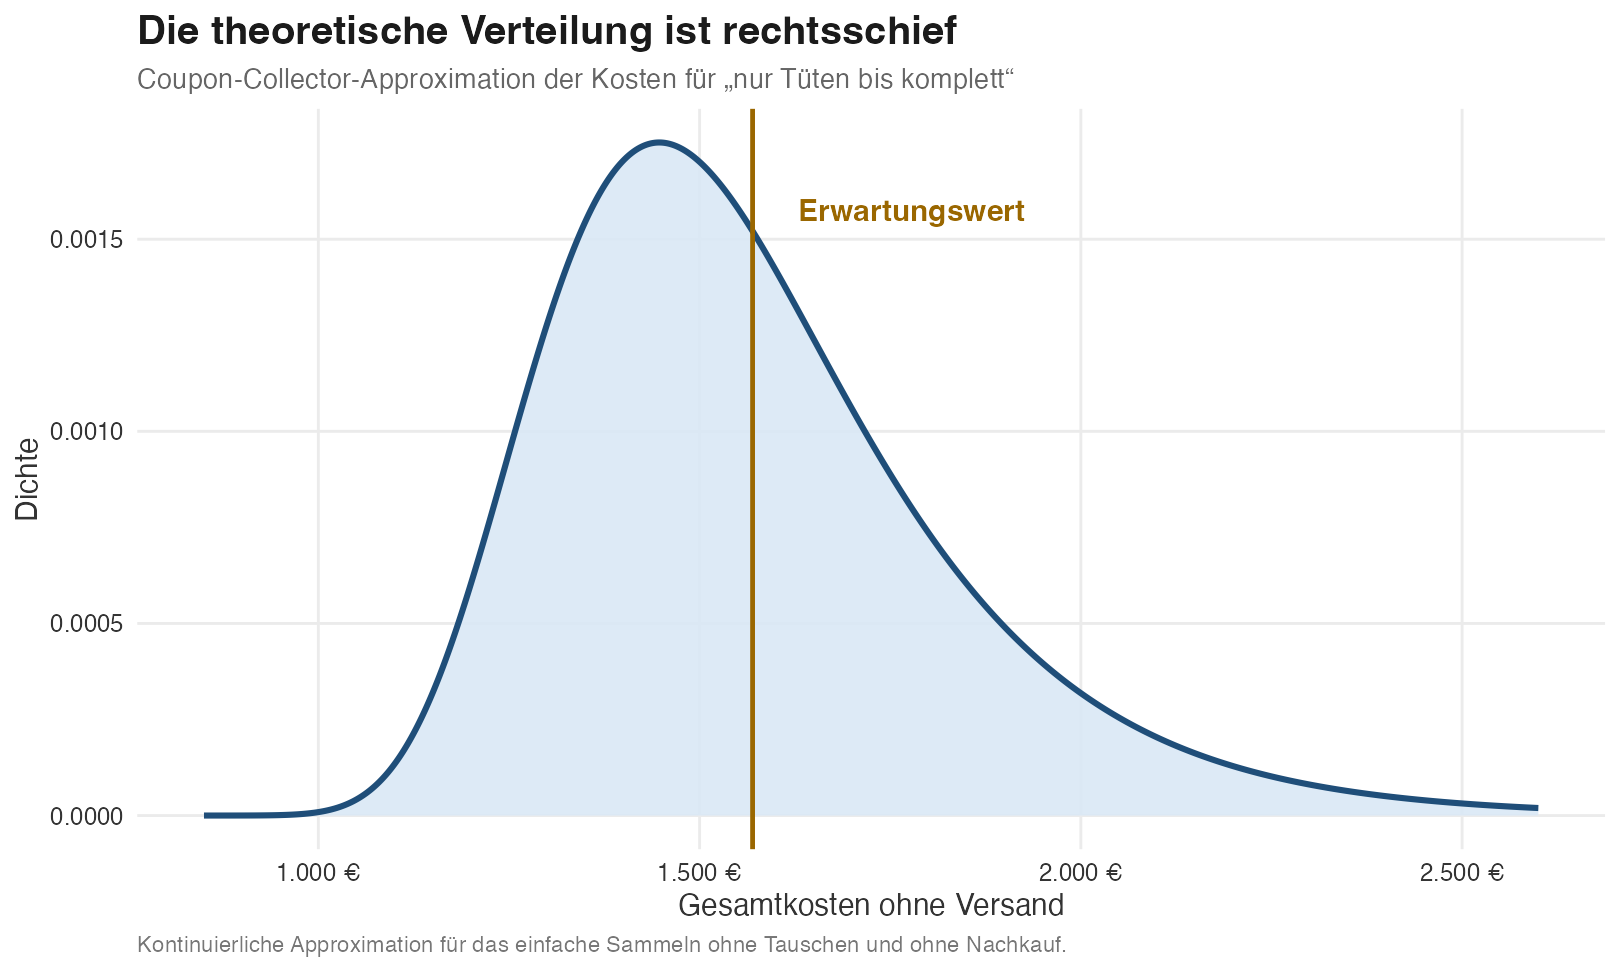
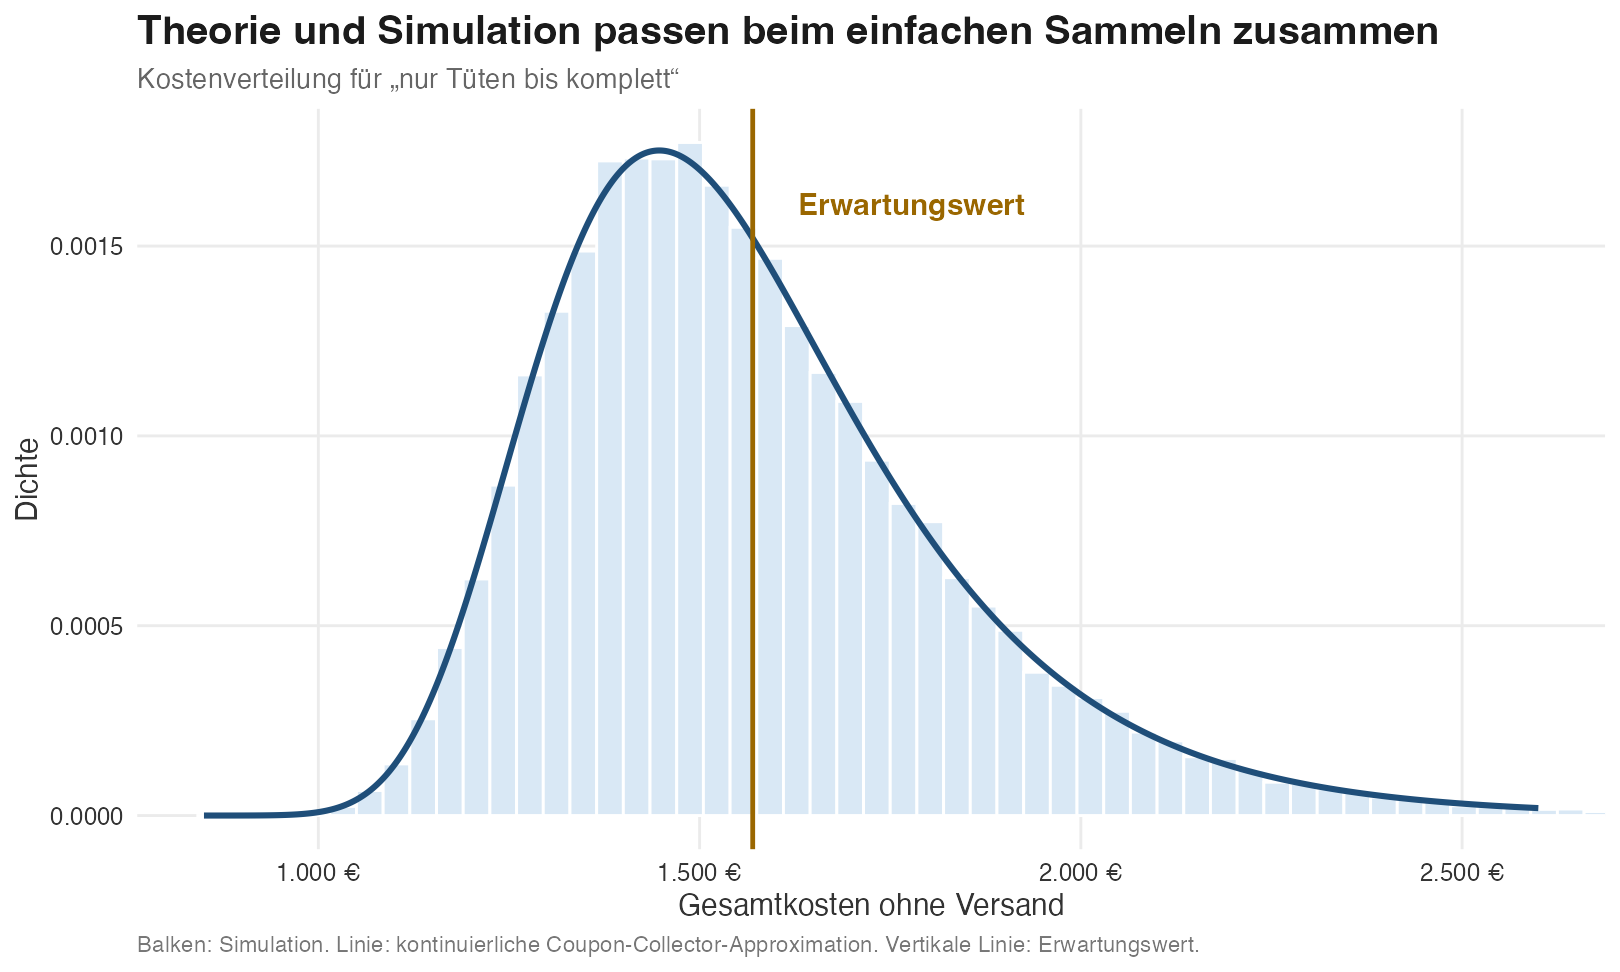
is approximately Gumbel-distributed, where \(T\) is the number of additionally purchased individual stickers and \(r\) is the number of motifs still missing at the start — here \(r = 974\), since six stickers are already in the album. Figure 2 shows the resulting theoretical density for the costs. The right skew is striking: the expected value lies visibly to the right of the peak of the distribution. This is typical for collecting problems, where rare long waits pull the average upwards.
Multiple stickers per pack
Panini packs are not quite this simple model, because you do not buy one sticker at a time but a small group of stickers. Stadje (1990) addresses exactly this variant as the “collector’s problem with group drawings”: you repeatedly draw groups of fixed size from a finite set and are interested in how many distinct elements have been collected after a given number of draws, or when a target number is reached. This fits sticker packs much better.
The expected value can be written in a fairly intuitive way in our simplified model. If \(b\) is the number of packs bought and each pack contains \(s = 7\) stickers, the probability that a particular motif has never been drawn after these packs is
\[ \left(1 - \frac{1}{n}\right)^{b \cdot s}. \]
The expected number of distinct motifs after \(b\) packs is therefore
\[ E(U_b) = n - (n - u_0)\left(1 - \frac{1}{n}\right)^{b \cdot s}, \]
where \(U_b\) is the number of distinct stickers after \(b\) packs and \(u_0\) is the number of distinct starting stickers. In our model \(n = 980\), \(s = 7\), and \(u_0 = 6\). This expected value curve is exactly what is shown in Figure 1.
Stadje goes beyond this expectation. Interesting is not only how many distinct stickers you have on average, but also the distribution: how likely is it to still have more than 50 gaps after a given number of packs? How likely is it to be complete already? These questions are actually closer to the collecting experience than the mean alone. In this post we use this theory mainly as structure: packs are group draws. The concrete cost question with reordering and trading is then answered by simulation.
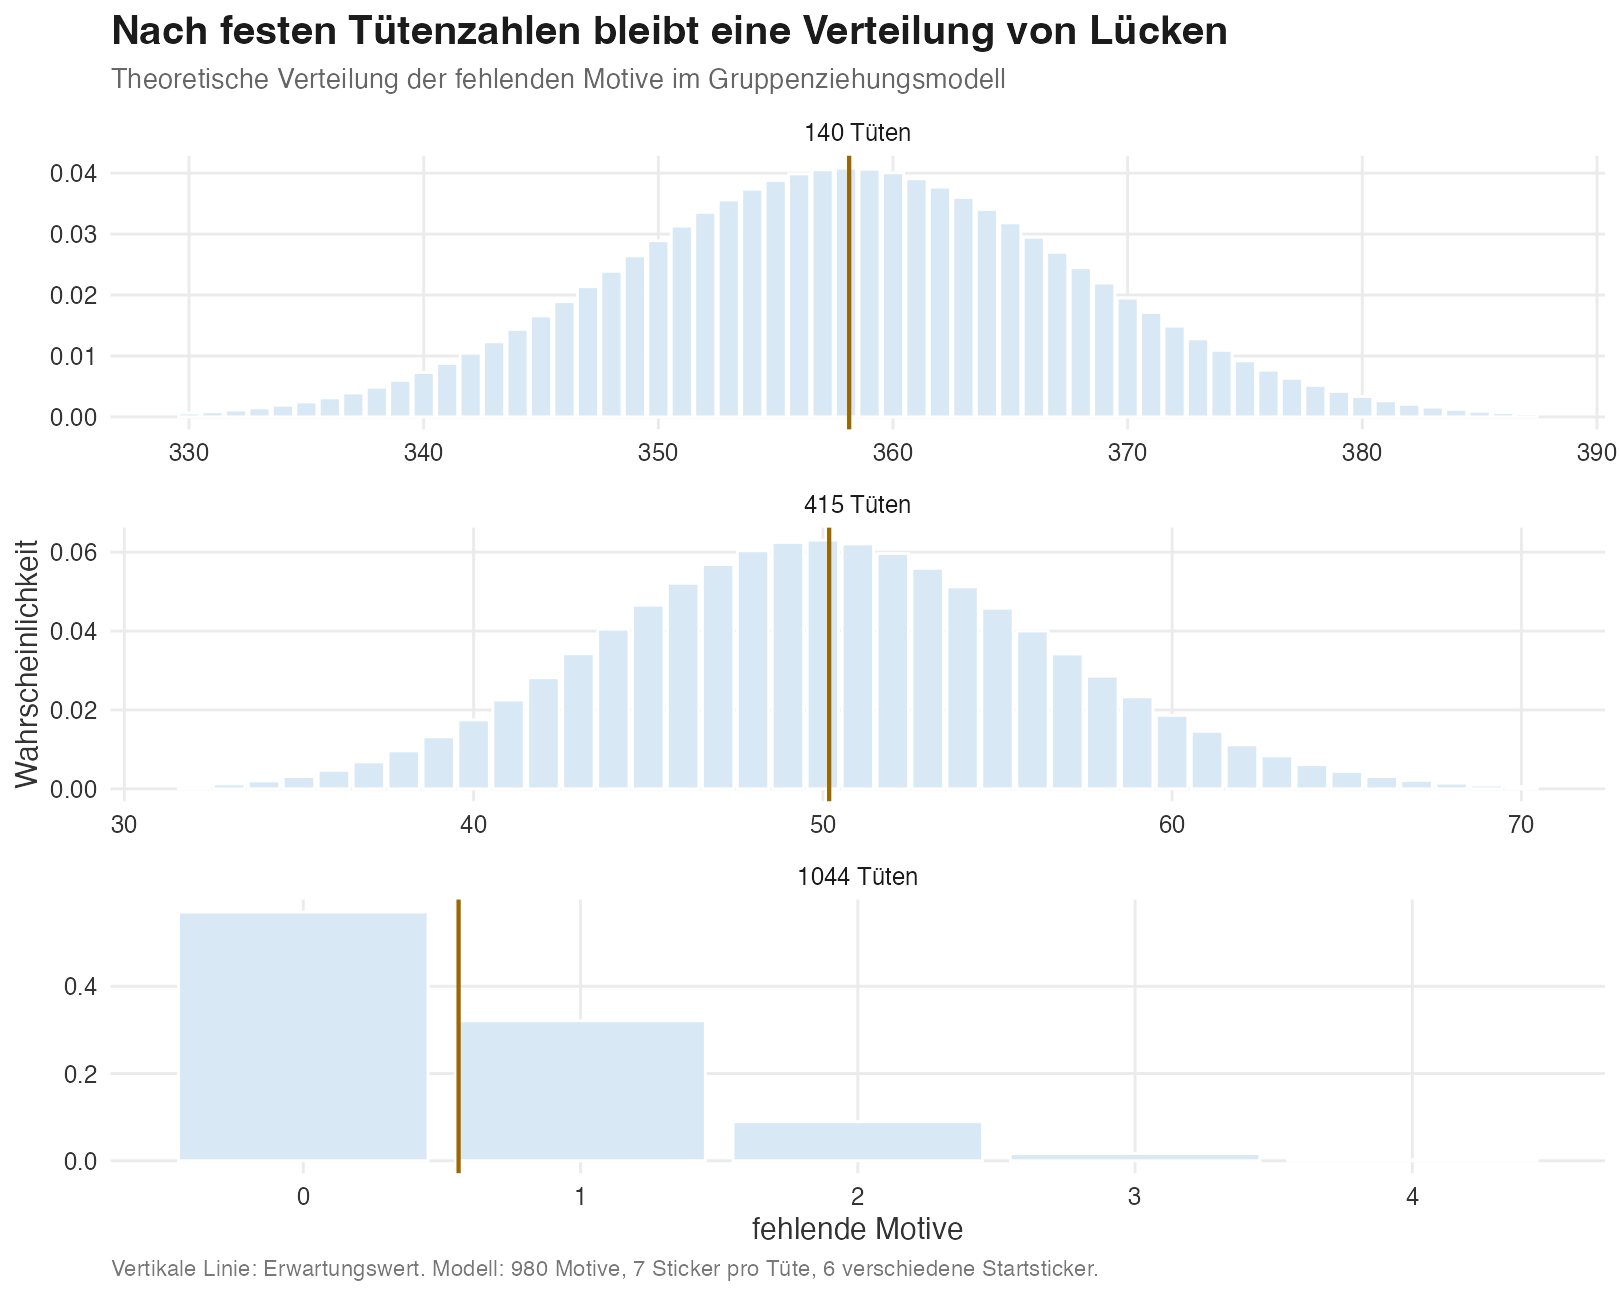
Figure 3 shows this distributional logic for three fixed pack counts. Strictly speaking this is not a continuous density but a discrete probability distribution: only 0, 1, 2, … stickers can be missing. After 140 packs, many motifs are typically still missing. After about 415 packs, the distribution is centred around 50 missing stickers. After 1,044 packs the album is often complete, but not always. That remaining right-tail probability is exactly why the expected value lies to the right of the peak.
Multiple complete albums
Then there is the problem of multiple complete albums. If two people collect together and trade perfectly, it is not enough for each motif to appear once in the combined pool. For two finished albums you need each motif at least twice, for five albums at least five times. This is exactly the idea behind the “Double Dixie Cup Problem” of Newman (1960). The name sounds like an American kitchen advert, but it is mathematically quite apt: you are not collecting one complete set of stickers, but several complete sets.
For fixed \(m\) and large \(n\), the expected number of draws needed for \(m\) complete sets is approximately
\[ n\left(\log(n) + (m-1)\log\log(n)\right). \]
Here \(m\) is the number of complete sets, so for ideal group trading without reordering roughly the group size. The first complete set is the hard part, costing \(n\log(n)\). Additional complete sets add roughly \(n\log\log(n)\) each. This is exactly why collecting in groups can be efficient despite needing multiple complete albums: the shared pool uses duplicates much more effectively than individual collectors can alone.
For the simulated group trading strategies this formula is not an exact benchmark — the simulation stops earlier and uses reordering, and it works with whole packs, an album price, a reorder limit, and an idealised trading pool. The Double Dixie Cup problem mainly explains the first column of the heatmap without reordering, and the direction of the effect: multiple complete albums are more expensive than a single shared complete set, but considerably cheaper than multiple people collecting in isolation.
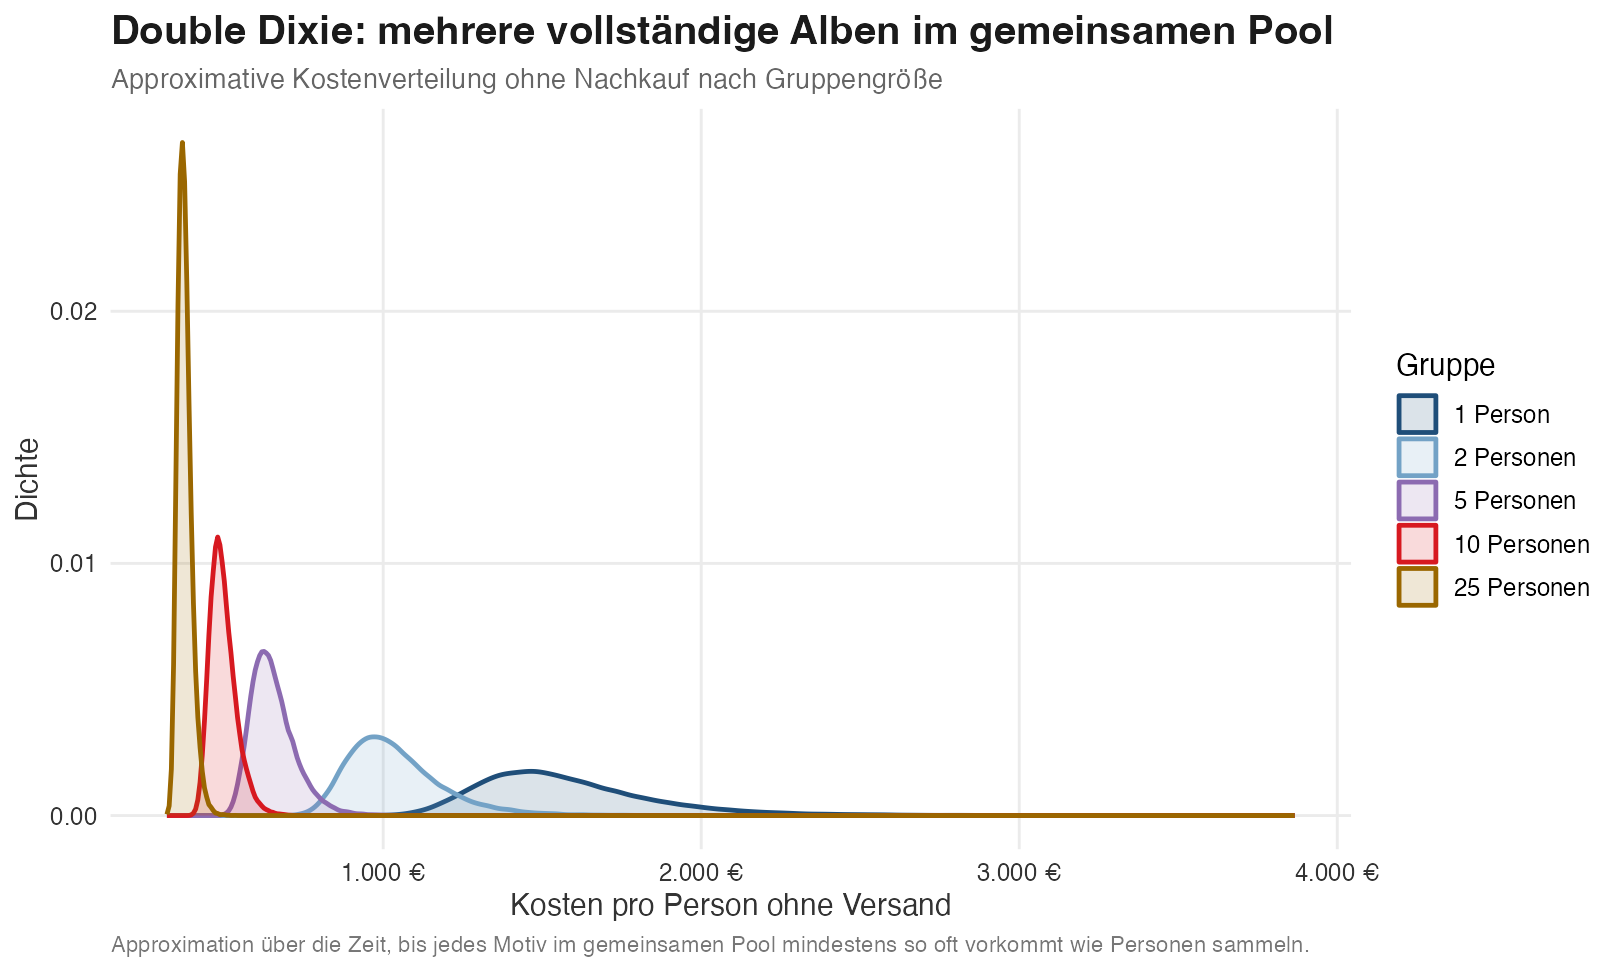
Figure 4 shows an approximate density of costs per person for various group sizes, this time without reordering. The curves shift left as the group grows — which sounds counterintuitive, since larger groups need more complete albums. But a larger group also collects considerably more material in the shared pool, and duplicates get converted systematically: what I have twice, you might still need.
A popular reference
For those who prefer a video: Numberphile (2018) covered the topic in “The Math (and Money) of Soccer Stickers” with Federico Ardila. The video description itself references the Double Dixie Cup Problem and calculations by Paul Harper at Cardiff University. Cardiff University (2018) reports that Harper calculated an average of 967 packs without trading for the 2018 World Cup album, and also described how strongly trading reduces expected costs.
Why simulate at all?
The theory shows the order of magnitude and explains why the last stickers are expensive. For the concrete cost question with packs, trading, and reordering it does not quite go far enough — not because it is too weak, but because the real collecting situation consists of several small rules that add up:
- The album does not start empty, but with six stickers.
- Stickers come in packs of seven, not as individual draws; this turns a continuous theoretical distribution into a distribution over whole packs.
- You buy whole packs. 414.39 packs do not exist.
- The reorder service only allows a limited number of missing stickers.
- Costs arise not only from draws, but also from the album price and the per-sticker reorder price.
- For trading, what matters is not just whether the shared pool eventually becomes complete, but how many missing stickers each person has left after a given number of packs bought.
The simulation translates this directly into a process: buy packs, count distinct stickers, trade ideally within the group, order missing stickers at the end. From 100,000 repetitions you get not just a mean but a distribution — some people are lucky, others keep pulling the same right back.
What the simulation shows
Table 1 summarises the results, costs per person including album, packs, and reorders, without postage.
| Strategy | Median | Mean | 80% interval | 95% interval | Mean packs |
|---|---|---|---|---|---|
| Packs only until complete | €1,524 | €1,570 | €1,274–€1,920 | €1,175–€2,218 | 1,045 |
| Packs until 50 missing + reorder | €648 | €649 | €616–€684 | €600–€704 | 415 |
| Group trading: 2 people | €480 | €479 | €476–€483 | €475–€484 | 305 |
| Group trading: 5 people | €339 | €339 | €337–€342 | €336–€343 | 211 |
| Group trading: 10 people | €288 | €287 | €285–€290 | €284–€291 | 176 |
| Group trading: 25 people | €253 | €253 | €251–€255 | €250–€256 | 153 |
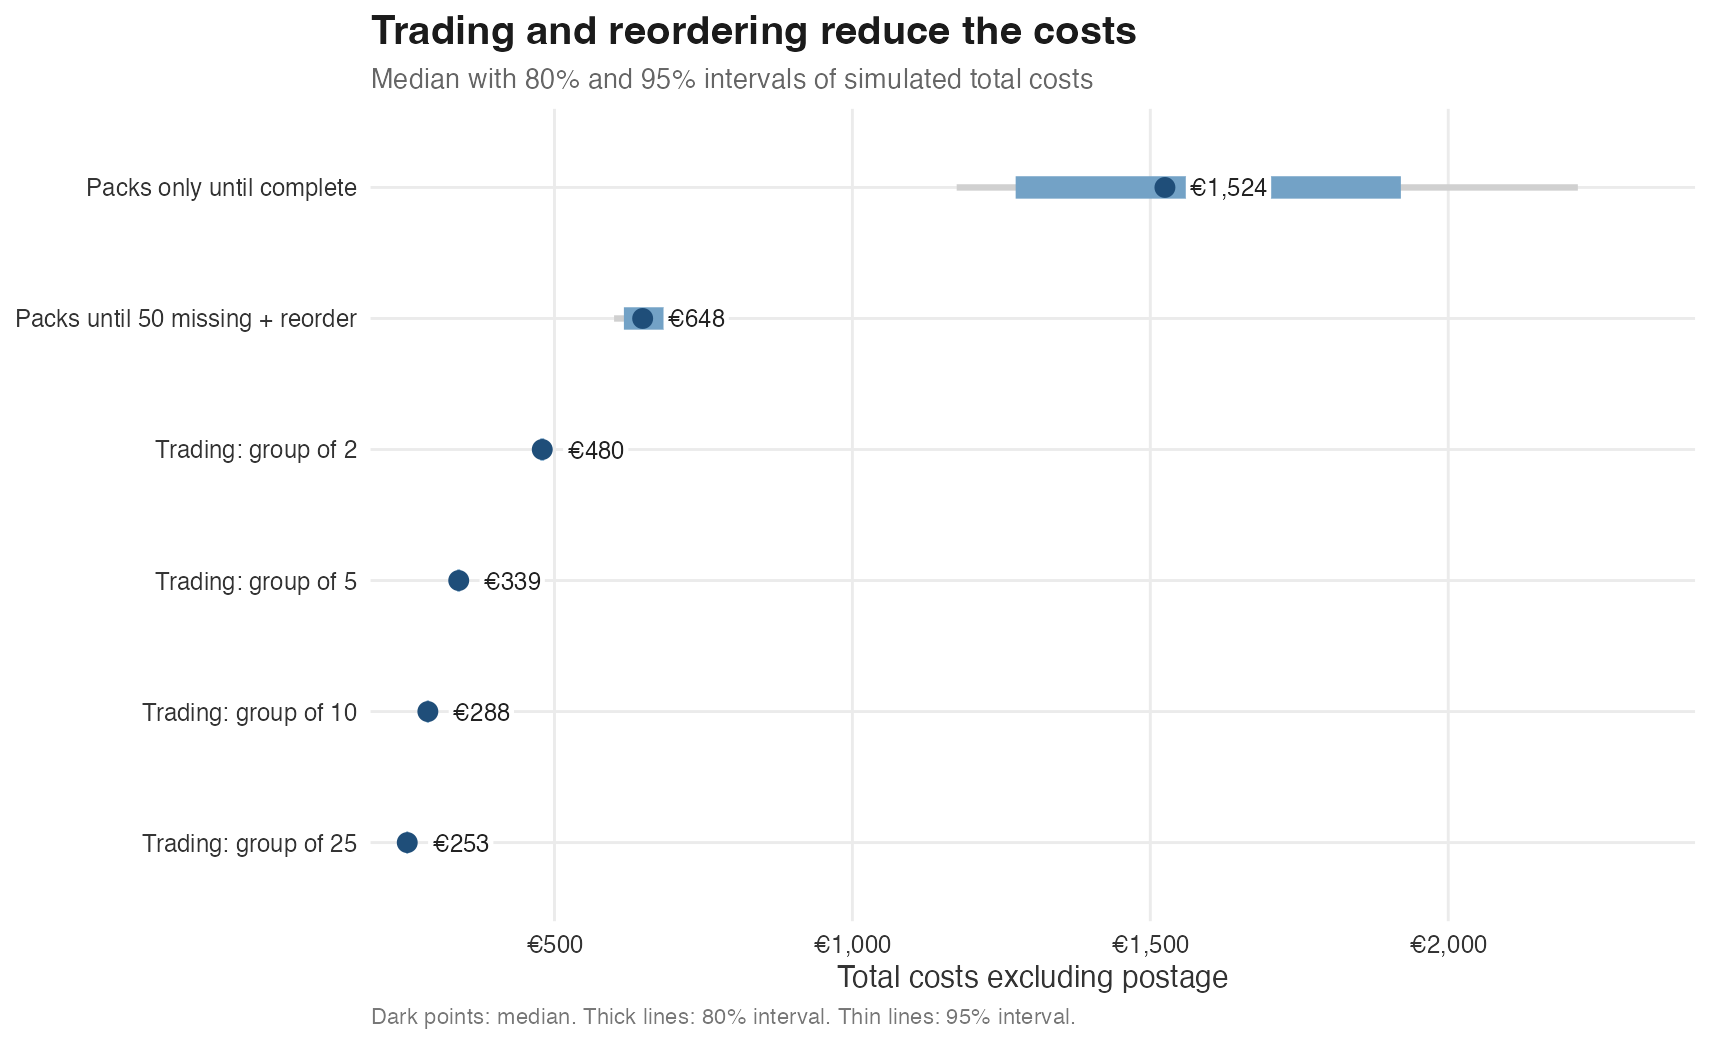
The gap from the naive calculation is enormous. Buying packs only, the median is around €1,524 — not the €210 that 140 packs would have suggested. This is not a small rounding error but the core of the coupon collector problem: the last gaps dominate the costs. Stopping at 50 missing stickers and ordering the rest brings the median down to around €648 — less than half.
For the simplest strategy we can also check the simulation against the theoretical distribution. Figure 5 overlays the coupon collector approximation from Figure 2 on the simulated cost distribution. The match is not perfect — the simulation buys whole packs, the theory does not — but it is close enough to treat the simulation as valid. That is the actual point of this comparison: not that theory and simulation give the same answer, but that you can trust the simulation when you apply it to the strategies with reordering and trading, for which no comparable formula exists.
Once you stop at 50 missing stickers and reorder directly, costs drop sharply. Trading helps further. Even a small group makes a difference, because duplicates within the group are no longer dead weight. A sticker I have twice is useless to me but might be exactly the last missing centre-back for you.
Figure 6 shows the simulated cost distributions as medians with 80% and 95% intervals. The spread matters: even with the same strategy, you can be lucky or unlucky. Some albums go surprisingly smoothly. Others develop a distinct personality after the third box.
Why trading works so well
Trading does not change the probability with which any individual sticker appears in a pack. It changes what happens to the duplicates.
Alone, a duplicate is a setback. In a group, it is a resource. The larger the group, the more likely someone still needs exactly that sticker. That is why expected costs fall considerably with group trading, especially when you also reorder directly at the end.
Figure 7 shows expected costs by group size and reorder threshold. The columns show at how many missing stickers you stop buying random packs and order the rest. The rows show the group size.
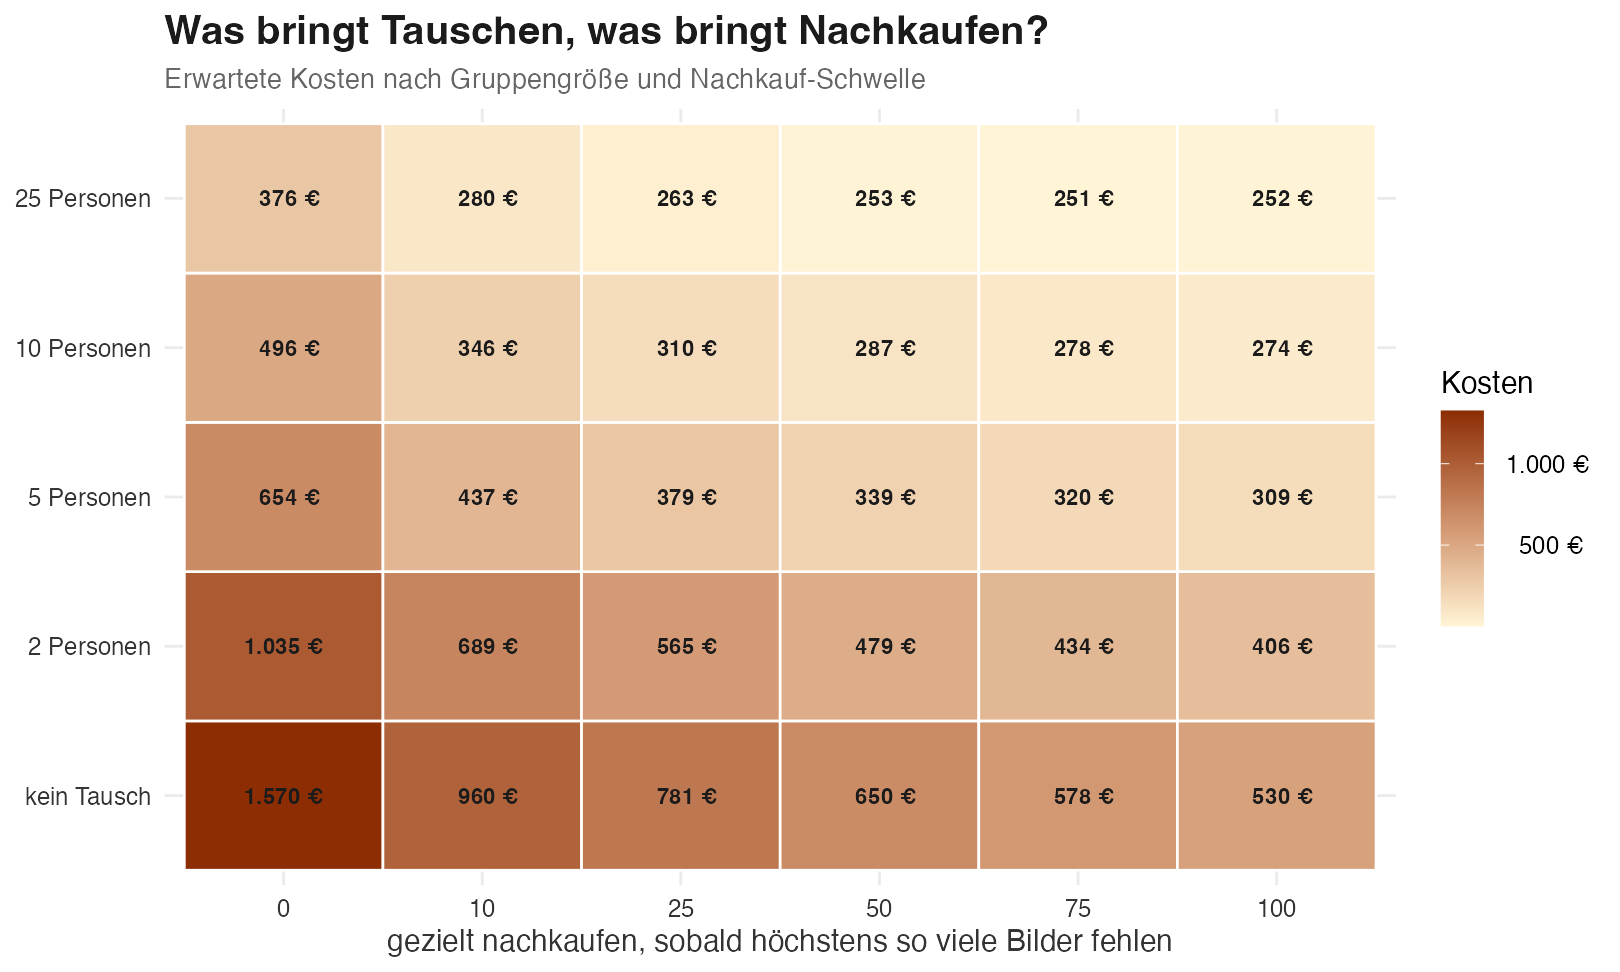
The first column is particularly strict: “0” means no targeted reordering. With group trading, the shared pool then needs not just one copy of each motif, but at least as many copies as there are people in the group. Two people eventually need two copies of every sticker, five people five copies, and so on. That is exactly the Double Dixie Cup logic. It is still better than collecting alone, but considerably worse than stopping in time and filling the last gaps directly.
The biggest jump does not come from complicated optimisation but from two simple decisions: do not keep buying random packs until the bitter end, and do not treat duplicates as personal failure — treat them as trading material.
What does this mean in practice?
If you are collecting just for fun, you do not need to turn this into a purchasing policy. It is perfectly fine to buy a few packs, enjoy the new stickers, and leave the rest of the album incomplete with dignity.
But if you really want to finish the album, a bit of statistical sobriety helps:
- At the start, packs are worthwhile.
- In the middle, trading pays off.
- At the end, reordering is almost always smarter than more packs.
That is perhaps the most grown-up and simultaneously least romantic Panini insight: the best moment is opening a pack. The most rational moment is when you stop.
Conclusion
A Panini album is not a cost problem because 980 stickers is a lot. It is a cost problem because random draws with duplicates become very inefficient towards the end.
The naive calculation with 140 packs understates reality considerably. But the simulation also shows: you are not entirely at the mercy of randomness. Trading and targeted reordering turn an expensive test of patience into a much more manageable project.
Or, in statistical terms: the variance remains, but you do not have to voluntarily throw another €1.50 per pack after it.