Why I Still Program in R in 2026
On mother tongues, quality gaps, and the quiet comeback of an underestimated language.
R
Python
DataScience
Programming
R or Python? This question has been asked in the data science community so often that it has almost become a meme — articles, blog posts, LinkedIn threads, conference panels. The debate has been running on a loop for years. So why write about it again? Because as someone who has worked with R for over two decades, I have the impression that many contributions to this debate either come from a Python perspective or reduce R to its weaknesses. This post is not a neutral comparison — it is an honest assessment from the perspective of an R user who knows Python, appreciates it, and still keeps coming back to R.
When I started studying statistics in 2003 🙈, I encountered for the first time a programming language designed specifically for working with data: S, and its commercial counterpart S-Plus. Both were widely used in academic statistics departments at the time — cumbersome, proprietary, expensive, but methodologically precise. The transition to R, built by John Chambers and later a growing global network of researchers as a free, open-source alternative, happened almost organically. It was simply better — and free.
R has remained in my toolbox ever since. Learning a language during your studies is different from everything that comes after: deeper, sometimes more fragmented, but somehow more formative. R is, if you will, my programmatic mother tongue. And what you have learned as a mother tongue, you do not simply give up — at least not without good reason.
That I have kept it is not nostalgia. There are arguments for it.
A Minority Language — with a Comeback
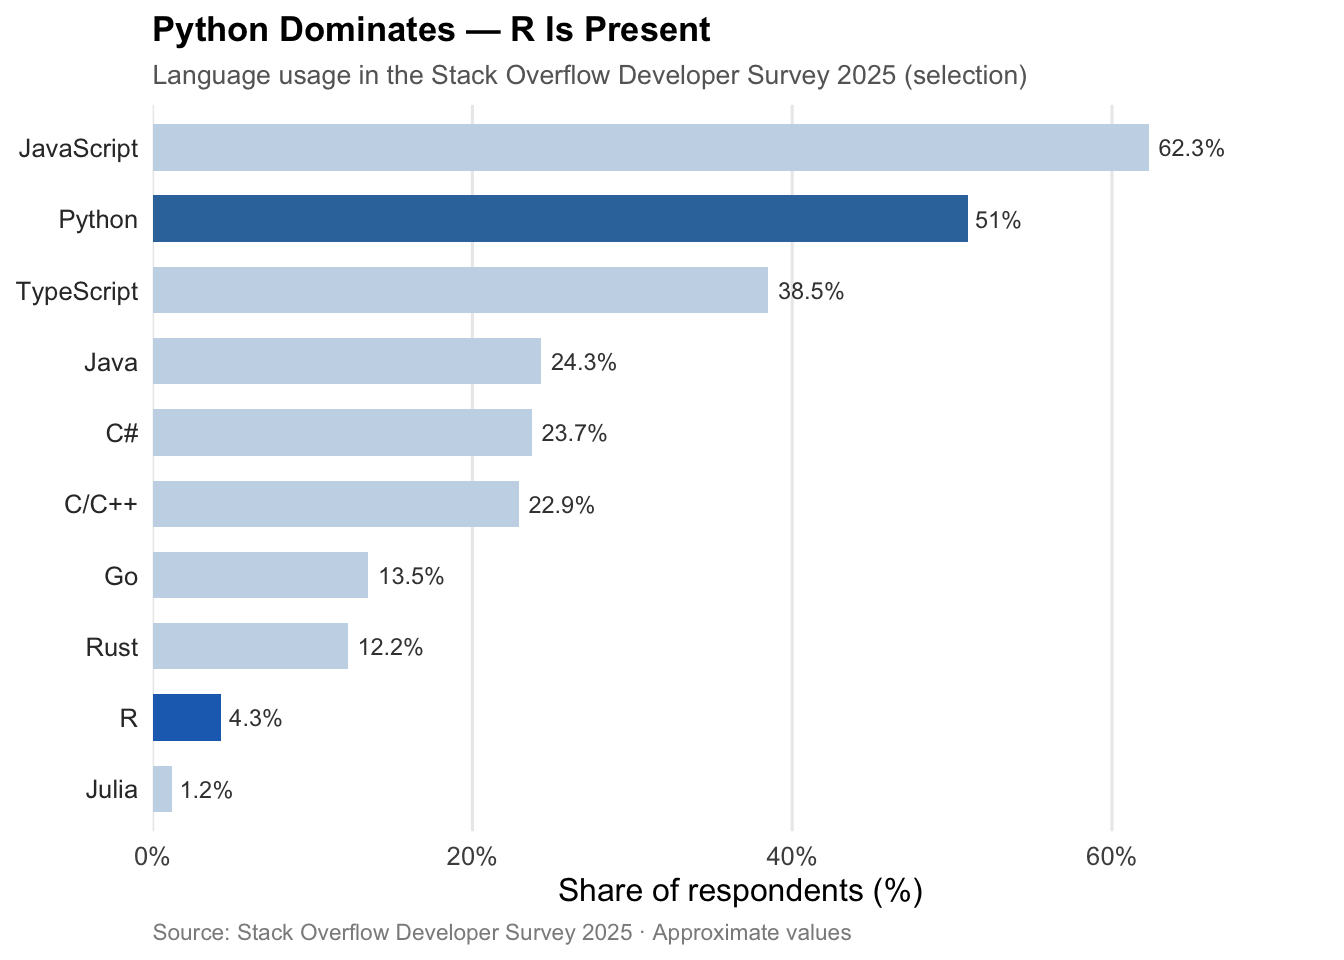
Looking at the world in 2026 soberly, things initially look sobering for R users. Python dominates. According to the Stack Overflow Developer Survey 2025, Python is the most desired language among developers worldwide, with a seven percentage point increase over the previous year — the largest single-year jump in over a decade (see Figure 2).1 Anyone looking for a job as a data scientist today will find Python in the overwhelming majority of job postings; R appears, but far less frequently.2 In terms of raw usage numbers, R is a minority language — and those who use it daily know this.
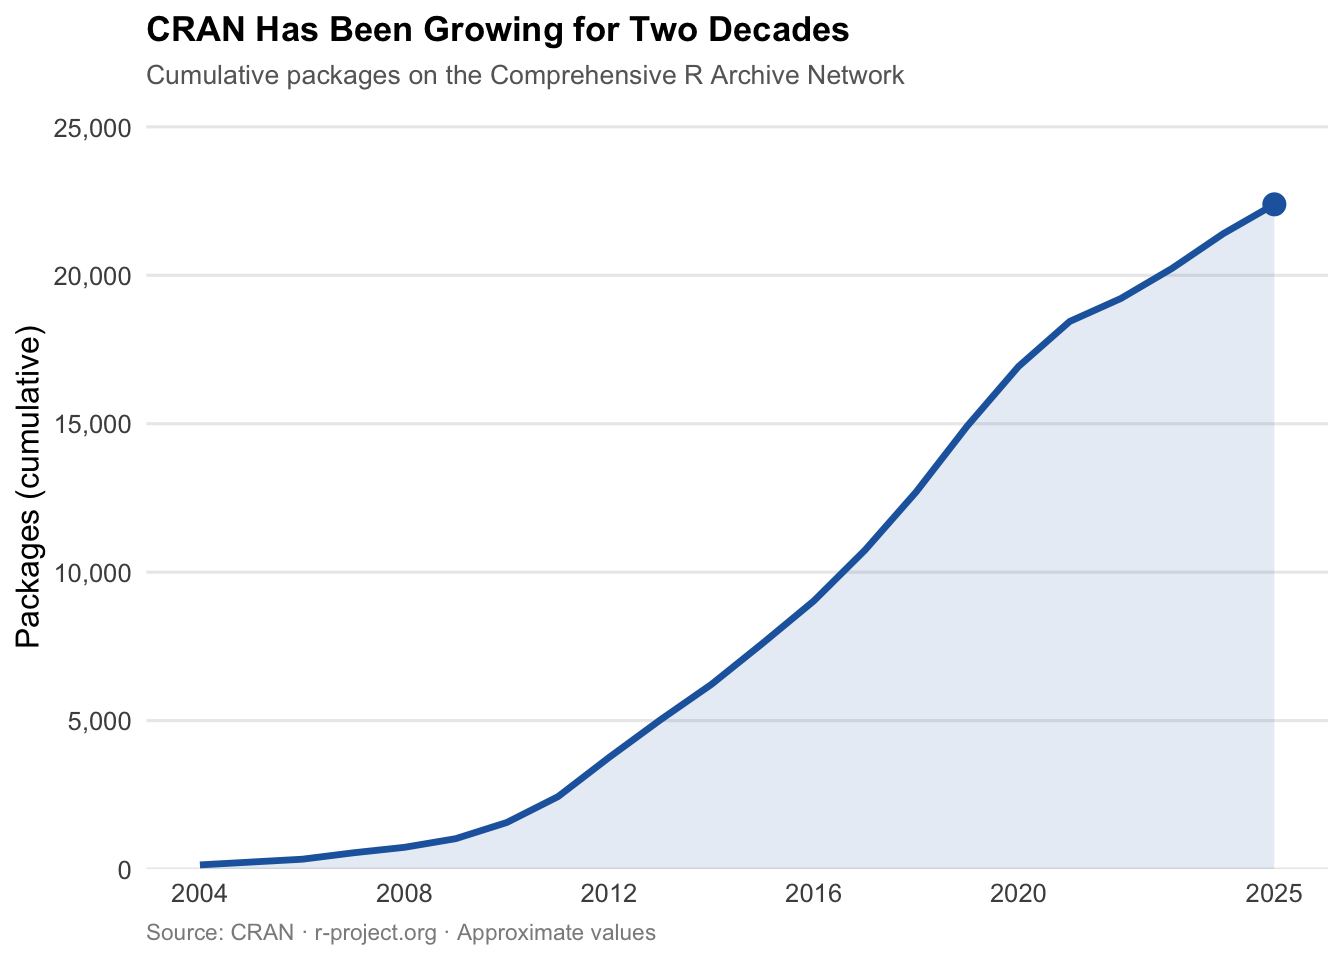
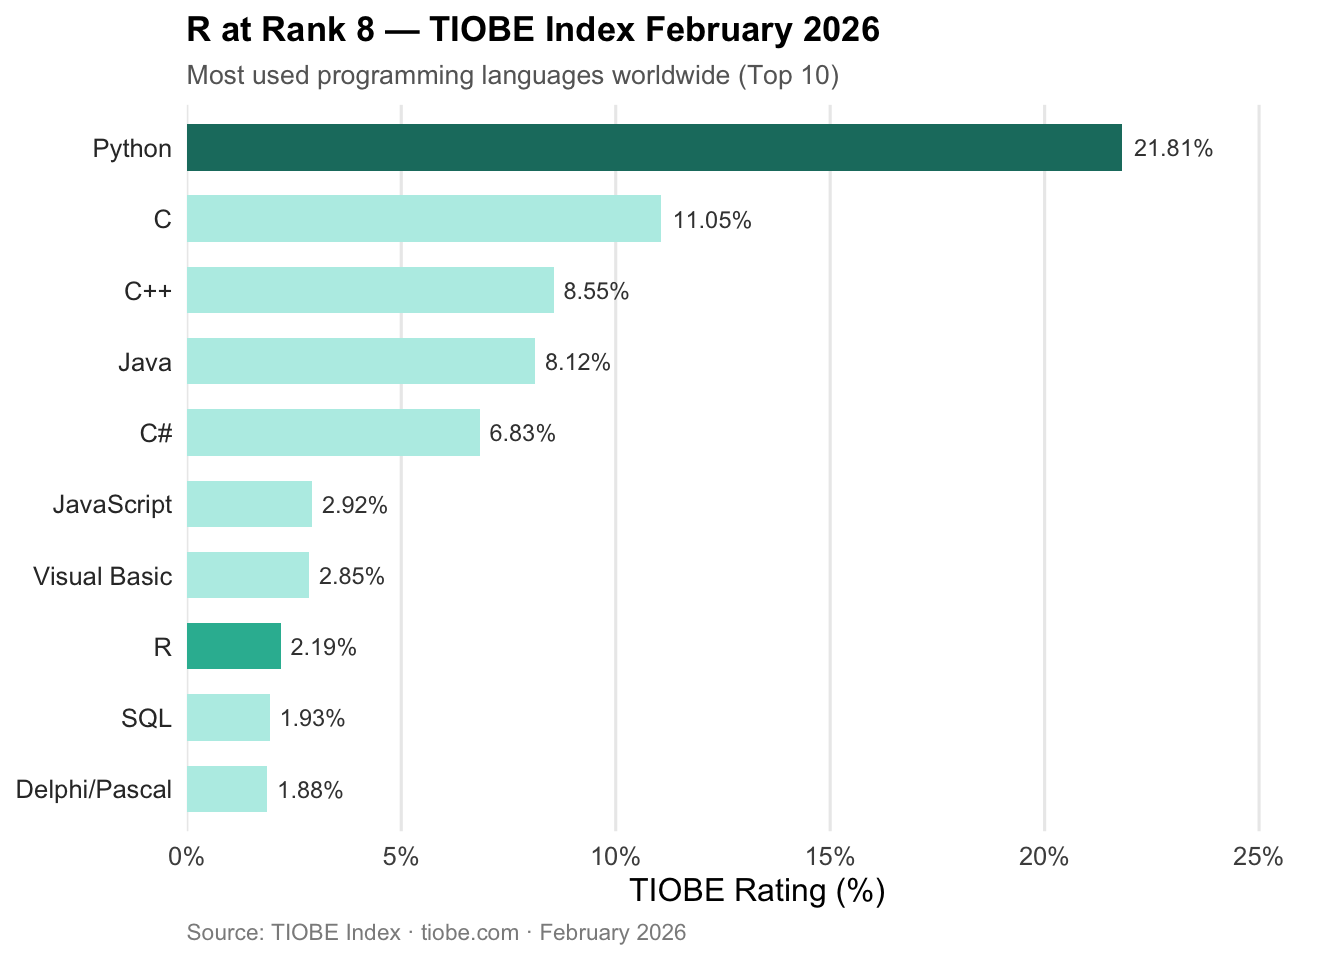
And yet: the TIOBE Index for February 2026 places R at rank 8 among the most used programming languages worldwide — up from rank 15 in February 2025, a jump of seven places (see Figure 3).3 This is not an outlier, but an expression of sustained relevance in exactly those domains for which R was designed: statistics, research, reproducible data analysis. As of June 2025, CRAN — the Comprehensive R Archive Network — counts 22,390 contributed packages (see Figure 1).4 A language that is dying looks different.
An Ecosystem that Sets Standards
What keeps me in R beyond the language itself is the ecosystem that has grown from it — one that has set standards in multiple respects that have not yet been fully matched elsewhere.
Starting with the tidyverse: a coherent collection of packages for the entire data analysis workflow — from data cleaning (tidyr, dplyr) to reading data (readr) to visualization — all based on a shared design philosophy and a unified grammar.7 Developed principally by Hadley Wickham and his team, the tidyverse has fundamentally changed how data analysis in R is written and read. What was previously heterogeneous and inconsistent became a language within the language.
The tidymodels framework extends this philosophy consistently into machine learning.8 With parsnip, over 100 model implementations — from linear regression to random forests to gradient boosting — can be called through a single, consistent interface: once you have learned how to specify a model, you can switch to any other without relearning the API. recipes handles feature engineering in reproducible, reusable steps; rsample standardizes cross-validation and resampling; tune automates hyperparameter optimization. The result is an ML workflow that is just as coherent as data analysis in the tidyverse — and which can be assembled into complete, reproducible pipelines with workflows.
As a complementary approach, mlr3 deserves special mention — a modern, object-oriented framework for machine learning in R.9 While tidymodels builds on the tidy philosophy, mlr3 adopts a rigorously object-oriented design with R6 classes, which is particularly powerful for complex ML experiments and systematic benchmarking studies. The mlr3verse extensions cover a broad spectrum: from mlr3pipelines for preprocessing pipelines to mlr3tuning for hyperparameter optimization and mlr3benchmark for systematic model comparisons. Especially in research, where a large number of models, learning tasks, and resampling strategies need to be systematically compared, mlr3 offers an expressiveness and flexibility that is hard to find in Python in this form (see Figure 4).

The most prominent single example from this ecosystem is ggplot2.10 It is based on the Grammar of Graphics — a coherent design philosophy that understands visualization as a composition of layers: data, aesthetics, geometries, coordinate systems. The result is an expressive power that still has no equal in the Python world. plotnine exists as a direct Python port of ggplot2 and is conceptually compelling — but in terms of maturity, documentation, and community depth, it has not yet reached the level of the original.11 matplotlib and seaborn are powerful, but think in fundamentally different ways. Once you truly master ggplot2, you are reluctant to go back.
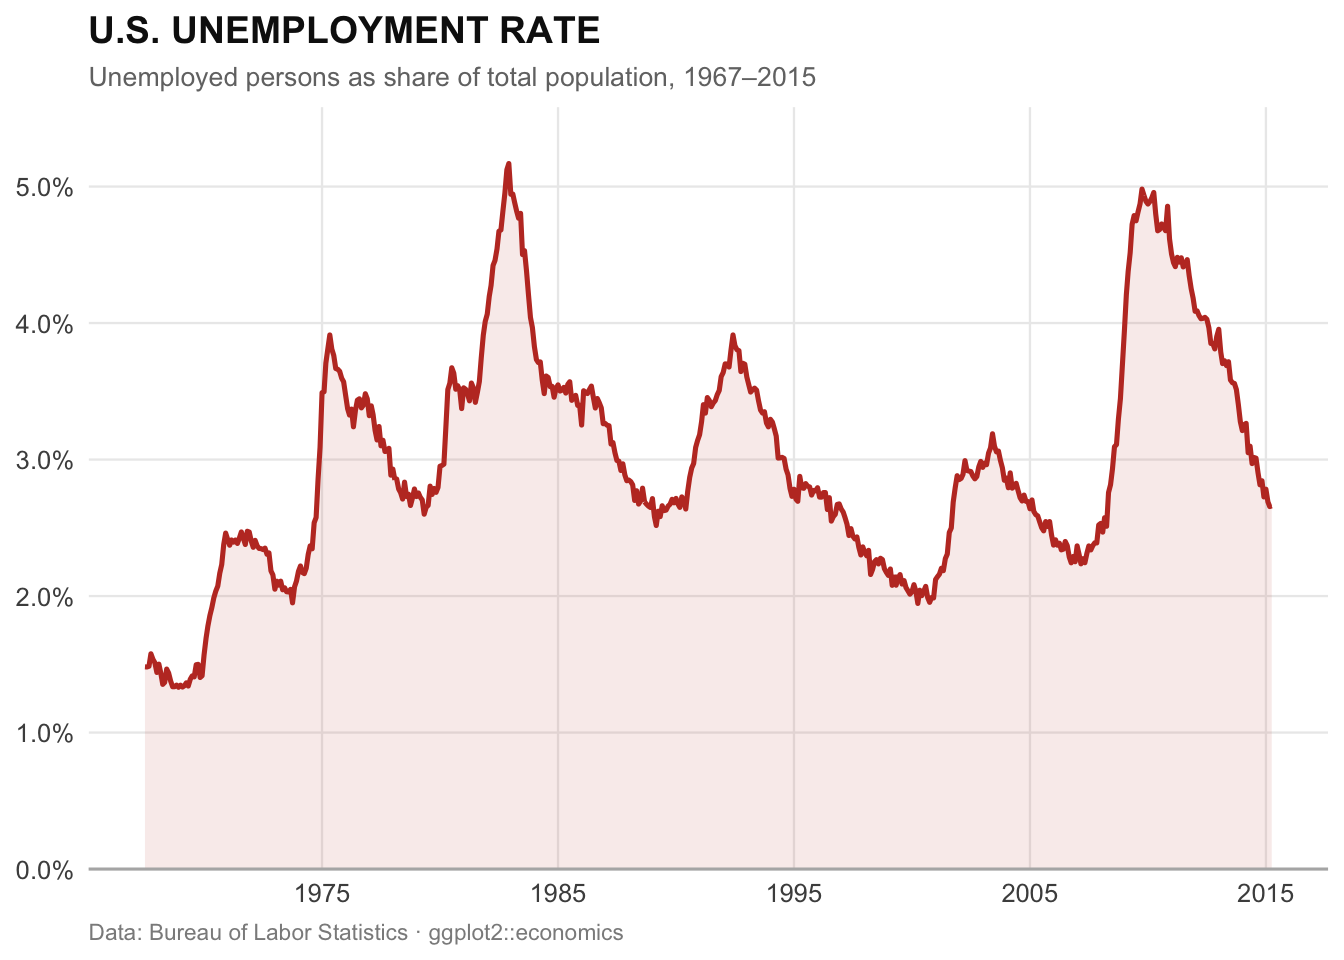
The fact that ggplot2 has become a standard in professional data journalism is illustrated by the New York Times: the NYT data journalism team was an early adopter of R and developed its characteristic editorial visualization style using ggplot2.12 Figure 5 illustrates the expressive power of the package using the built-in economics dataset — in a clean, editorial style:
Even more significant for my daily work is Quarto, the scientific publishing system from Posit that evolved from R Markdown.13 Quarto is one of those developments you only truly appreciate once you use it intensively. I use it today for almost everything I write and publish: lecture materials that can be rendered as interactive websites or PDFs; this website; research papers where code, results, and text coexist in a single document; presentations. All of this from a single source, a single workflow, with consistent formatting and full reproducibility. Quarto is now language-agnostic — it supports R, Python, Julia, and Observable equally — but it grew from the R community, and you can tell by the care of its design.
tidyverse, ggplot2, Quarto: these are not just tools, they are conceptual contributions to how we think about and work with data — and they have had an impact far beyond the R world.
R
tidyverse
ggplot2

Quarto
Python and the Problem of Tool Fragmentation
Someone who knows R sees the Python ecosystem with different eyes. Python’s strength — its sheer openness — is also its greatest source of operational complexity. Working with Python today means choosing between pip, conda, poetry, pipenv, and now uv, each with different behaviors for version resolution, different lockfile formats, and different platform support.14 In productive environments with multiple projects and teams, version conflicts can cause real costs: dependencies that exclude each other; environments that work on one machine and not on another; I have spent hours debugging error messages that had nothing to do with the actual problem.
A concrete example from 2024 illustrates this well: the latest versions of proto-plus and grpcio-status could not be installed simultaneously because both required incompatible versions of protobuf.15 Nine of the hundred most-used PyPI packages could temporarily not all be updated to their latest versions simultaneously.
To be fair: the Python ecosystem is actively and visibly working on these problems. uv, a package manager written in Rust, gained significant traction in 2025 and is, in my assessment, a genuine breakthrough for Python.16 Reproducible lockfiles, clean dependency lists, a clear project structure — and all of this at a speed that surpasses pip by orders of magnitude. It is interesting to observe how uv conceptually drifts toward what renv has long provided in R — an irony that R users can note with a smile. The fundamental architecture of the Python ecosystem remains different from R’s: more decentralized, more open, more fragmented — with all the advantages and disadvantages that come with that.
Posit: When a Company Takes Open Source Seriously
A factor that is often undervalued in discussions about R is the role of Posit — renamed from RStudio, PBC in 2022.17 Posit has developed a business model that differs fundamentally from classical software commercialization: the company employs full-time the core authors of the most important R packages — tidyverse, ggplot2, Shiny, Quarto — and finances their development entirely as open source. For users, everything is free and open source; Posit earns its money with enterprise products and hosting. The result is a quality and continuity in package development that purely community-driven projects rarely sustain in the long run.
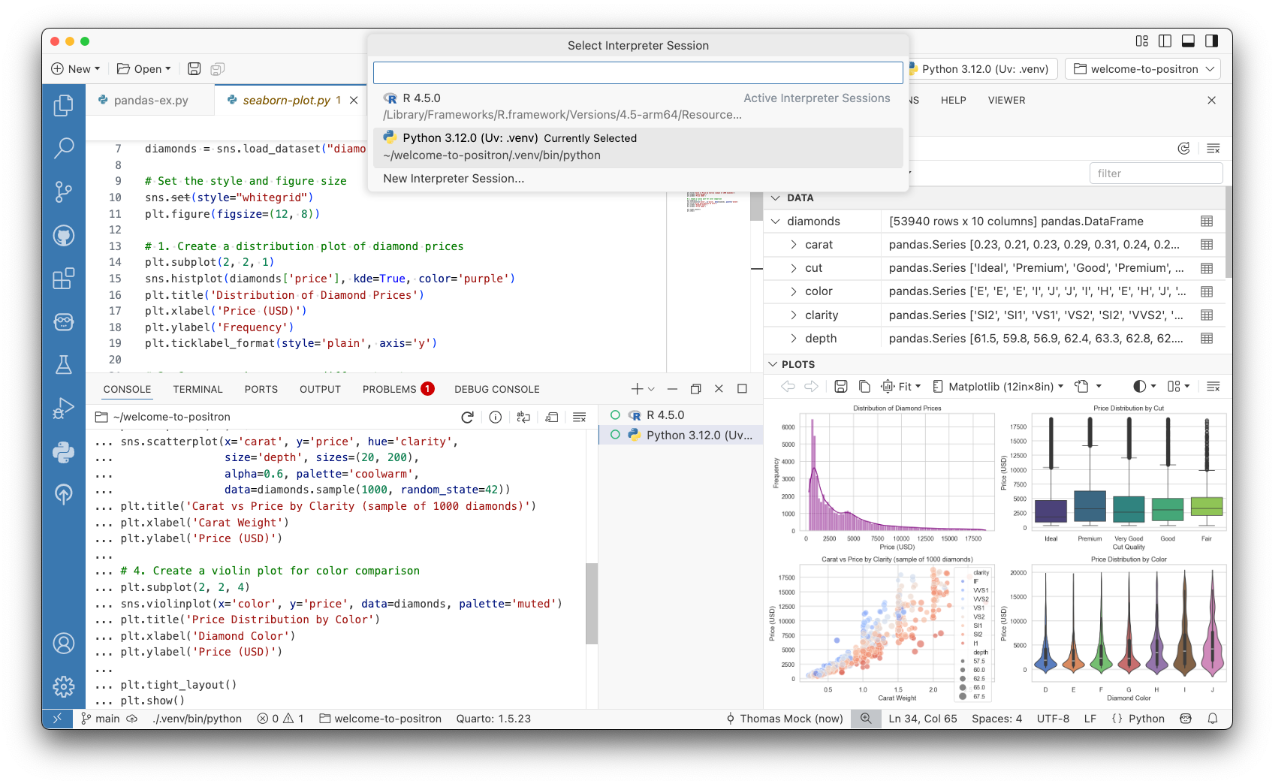
On the IDE side, Positron is now central: a development environment made generally available in 2025, built on the open-source core of Visual Studio Code (Code OSS) — essentially a VS Code fork specialized for data work.18 This means VS Code users feel immediately at home — the familiar layout, keyboard shortcuts, and the entire VS Code extension ecosystem are immediately available. What Positron brings in addition are features tailored for data work that would need to be laboriously assembled in plain VS Code: a dedicated Variables Pane listing all in-memory objects with type, dimensions, and preview; an integrated Data Explorer with table view, filtering, sorting, and column summaries; a Plots Pane displaying visualizations directly next to the code; and native, language-specific consoles for R and Python with full code completion. All of this with equal support for R and Python in a single environment (see Figure 6).
For teaching, there is another aspect that is usually completely overlooked in these discussions: Posit Workbench. This is the server-based variant of the Posit development environment, which Posit provides free of charge to educational institutions through academic licenses.19 I use it in my courses — and the difference is substantial. Students open a browser, log in, and immediately work in a fully configured R and Python environment. No local setup, no version conflicts on personal laptops, no “it doesn’t work on my machine” in the first lecture. Everyone works in the same environment, with the same package versions. For collaborative exercises and reproducible analyses in teaching, it is a tool I would not want to be without.
Not a Real Programming Language? This Myth Persists
Mention R in mixed developer circles and you will sometimes hear: R is not a real programming language. R is slow. R is not suitable for production. These objections have been repeated for years — and refuted for years. Yet they persist with remarkable tenacity.
Let us start with the most direct: R is of course a fully capable programming language. It is Turing-complete, supports object-oriented programming in multiple forms (S3, S4, R6), functional programming, metaprogramming, and first-class functions. The myth probably stems from the observation that many R users are not classical software engineers — statisticians, biologists, economists who learned a language for data analysis, not for systems software. But that is a statement about the user community, not about the language itself.
The performance argument is more nuanced — and often simply misapplied. Yes, naive R loops over individual elements are slow. But that is not an R-specific problem; it is the typical behavior of interpreted scripting languages — the same applies to Python. The key point: R was built from the ground up around vectorization. Operations like mean(), sum(), or lm() are not interpreted R loops, but calls to highly optimized C code running underneath. Using R as it was designed gives runtimes that are on par with Python. For targeted additional performance, data.table is available — one of the fastest in-memory data manipulation tools available in any language20 — or Rcpp, which enables seamless integration of C++ code into R.21
What I, as a native R speaker, only became aware of when learning other languages: vectorization in R is not an extension — it is the default assumption. When I write x * 2, R automatically multiplies every value in the vector x — no loop, no explicit iteration. This is so natural that you simply take it for granted. The moment of realization came when switching to other languages: in Java or C you write explicit loops for that; in Python you need NumPy. NumPy solves the problem excellently — but it is a library you have to load, not the base behavior of the language. In R, vector thinking is not a convention, it is the language itself.
And production use? Here too, reality has long overtaken the myth. With plumber, R code can be turned into a full REST API with just a few comments.22 Shiny enables the development of production-ready web applications directly from R — with its own conference (Shiny in Production, 2025) and a growing enterprise user base.23 vetiver standardizes the MLOps workflow for deploying models in both R and Python. AWS has integrated RStudio directly into Amazon SageMaker — a clear signal that the cloud provider considers R production-relevant.24 And in the big data world, R has long arrived: Databricks, one of the leading data platforms, supports R through sparklyr — a package that provides a tidyverse-compatible interface to Apache Spark, enabling R code to run directly on Databricks clusters and in the Unity Catalog environment.25 In the pharmaceutical industry and clinical research, R has been the de facto standard for years: the FDA accepts R-based statistical analyses for regulatory submissions, and companies like Amazon, Google, Ford, and Novartis actively use R in production environments.26
In short: the charges of inadequacy, slowness, and unsuitability for production describe R at best from the early 2000s — not the language and its ecosystem in 2026.
Where Python Clearly Wins
Honesty is required: in the field of artificial intelligence, and especially generative AI, Python is simply the better choice. LangChain, Hugging Face transformers, PyTorch, LlamaIndex — these libraries have no equivalent in R. The momentum of this development is carried by Python, and that will not change in the foreseeable future. Anyone today fine-tuning large language models, building RAG systems, or developing AI agents works in Python — not out of habit, but because the infrastructure is simply there.
There is another point that R users should acknowledge honestly: the quality hurdles of CRAN, which I described above as a strength, also have a downside. Anyone who wants to develop a package quickly and iteratively will experience the CRAN process as a brake. New methods, new APIs, new paradigms — in PyPI they are often available weeks or months earlier. Anyone working at the cutting edge of current AI research pays for the reliability of the ecosystem with timeliness.
Conclusion: Mother Tongue with a Clear Head
R and Python are not opponents. They are optimized differently — for different tasks, different contexts, different users. For statistical modeling, scientific analysis, reproducible reporting, visualization, and academic publishing, R remains an exceptionally well-designed tool — maintained by a core team with high quality standards, supported by Posit as an institutional backbone, and enriched by a community that produced ggplot2, the tidyverse, and Quarto. For AI development, large language models, and broad production integrations, Python has much to recommend it.
In my own work I use both. But when I explore data, interpret models, make an analysis reproducible, or write a paper — R is the tool of choice. Not out of nostalgia, but because it still fits these tasks best.
And because you never fully unlearn a mother tongue.
Footnotes
Julie Tibshirani: “If All the World Were a Monorepo” – Substack↩︎
How The New York Times Visualizes Data Using R – Revolution Analytics Blog, 2011↩︎
Quarto – Open-Source Scientific and Technical Publishing System↩︎
Navigating the Python Dependency Hell for Package Publishers – Medium↩︎
Introducing Positron: A New, Yet Familiar IDE for R and Python – Appsilon↩︎
R You Ready? Unlocking Databricks for R Users in 2025 – Databricks Blog↩︎
Options for Deploying R Models in Production – GeeksforGeeks↩︎